As always, I should caveat that I'm not an expert either in football or programming...I started learning R in December and have gradually reached a 'mildly competent' level.
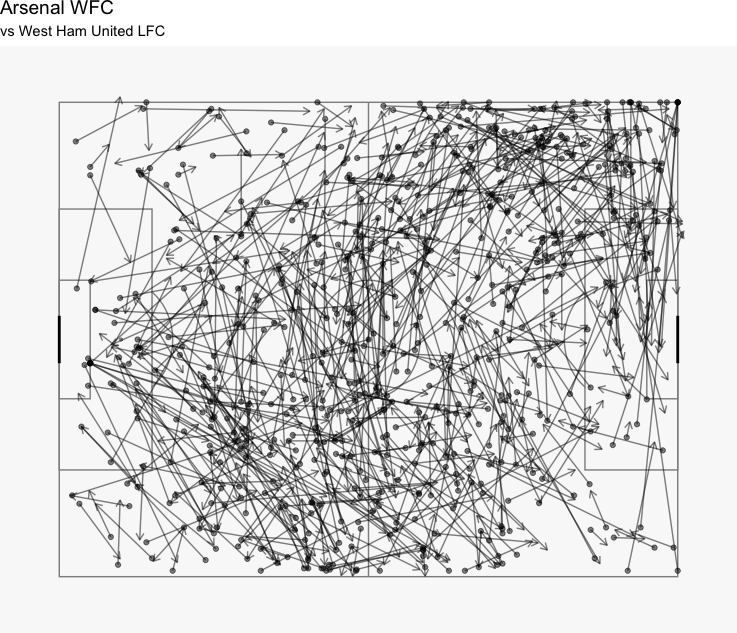
This will go through installing R, loading the StatsBomb data, then plotting a pass map - something like this:
Anyway, away we go.
Thing number 1 - install R. There are two things to load...the R 'base' and Rstudio.
You can download Rstudio here:
https://rstudio.com/products/rstudio/download/
The first 3 minutes of the below shows the process:
https://www.youtube.com/watch?v=BuaTLZyg0xs&list=PL6cDc8Xxld162nSsZ14bQnFn1cYStsrtk&index=2&t=0s
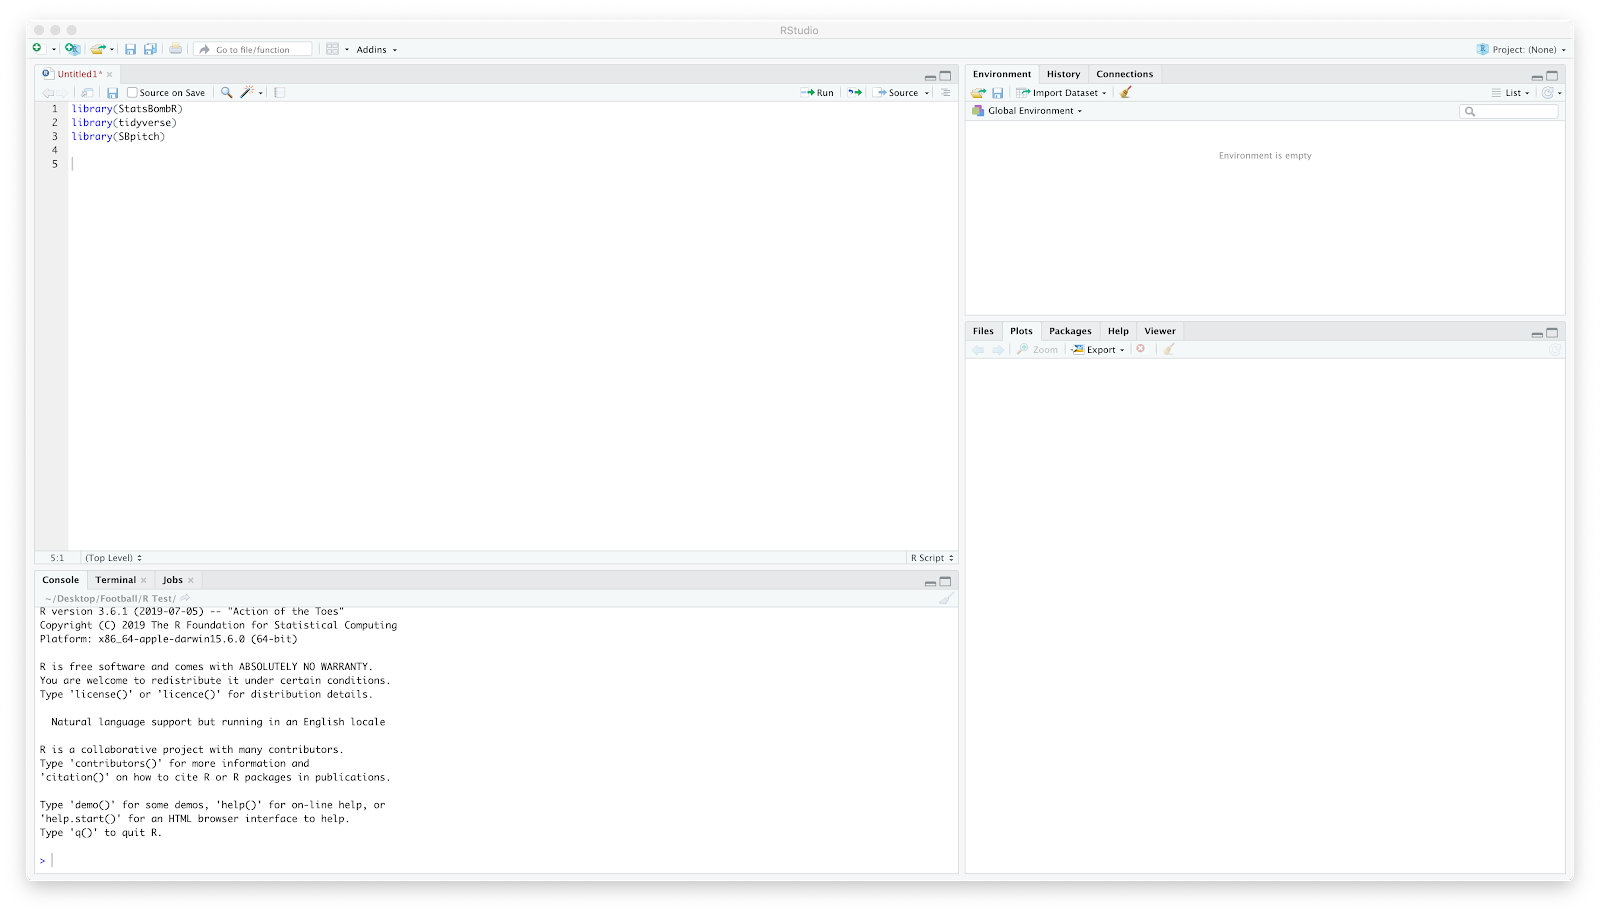
That is now hopefully R loaded. Open Rstudio and you should be greeted with something like this:
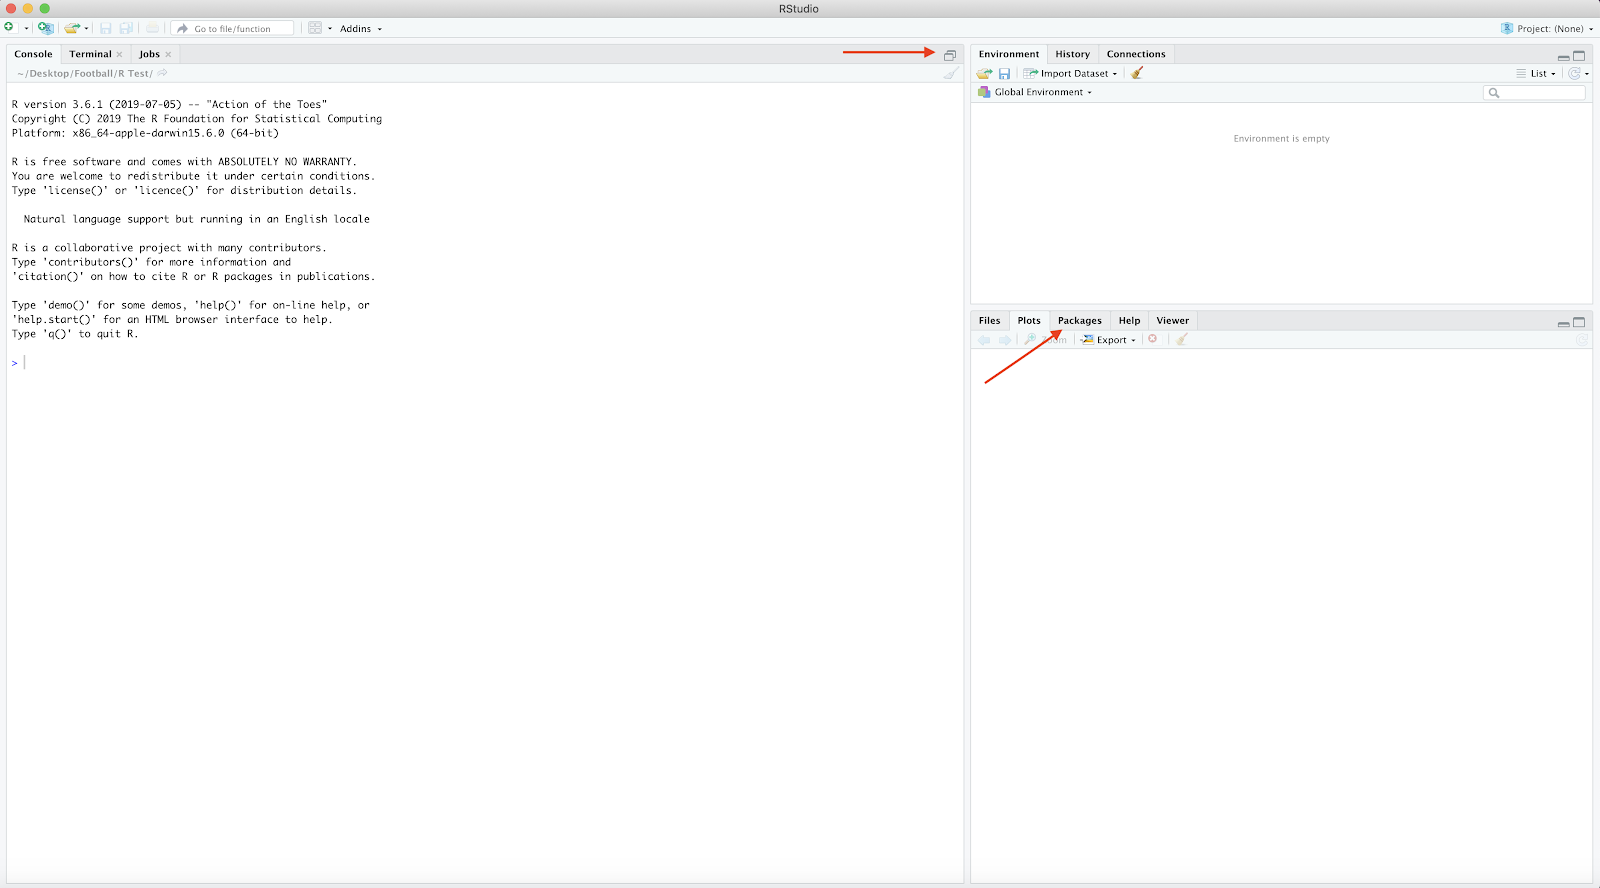
Press the arrow areas to reveal:
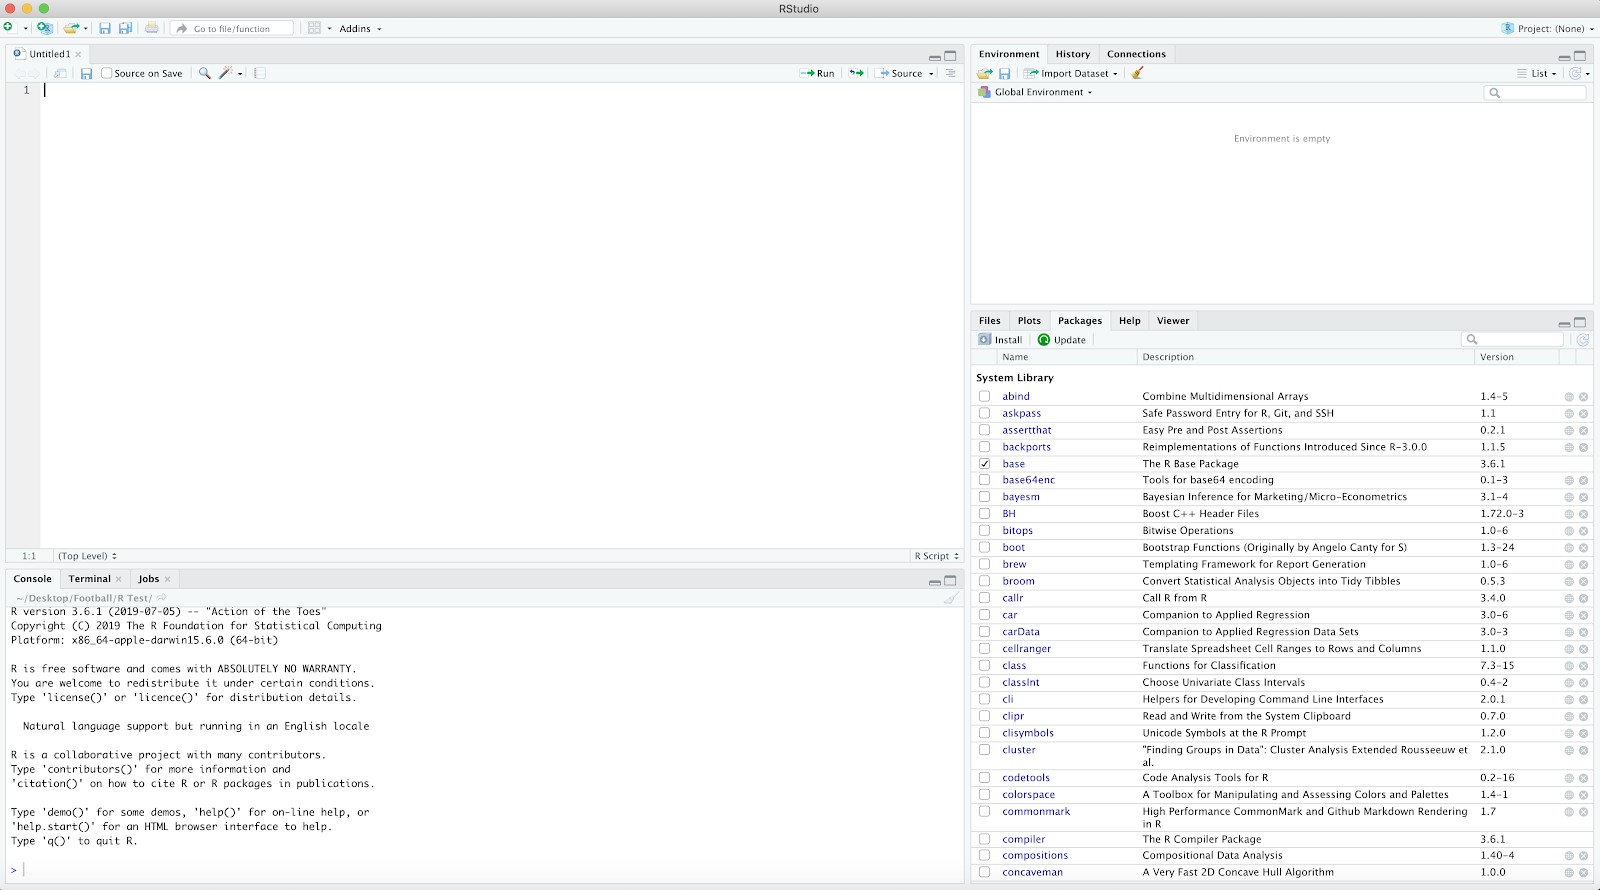
Under the 'Packages' tab select 'install' and search 'devtools'..install package. Repeat the previous step however search 'tidyverse'.
Next steps are to load in the StatsBomb data and FCrSTATS pitch:
devtools::install_github("statsbomb/StatsBombR")
devtools::install_github("FCrSTATS/SBpitch")
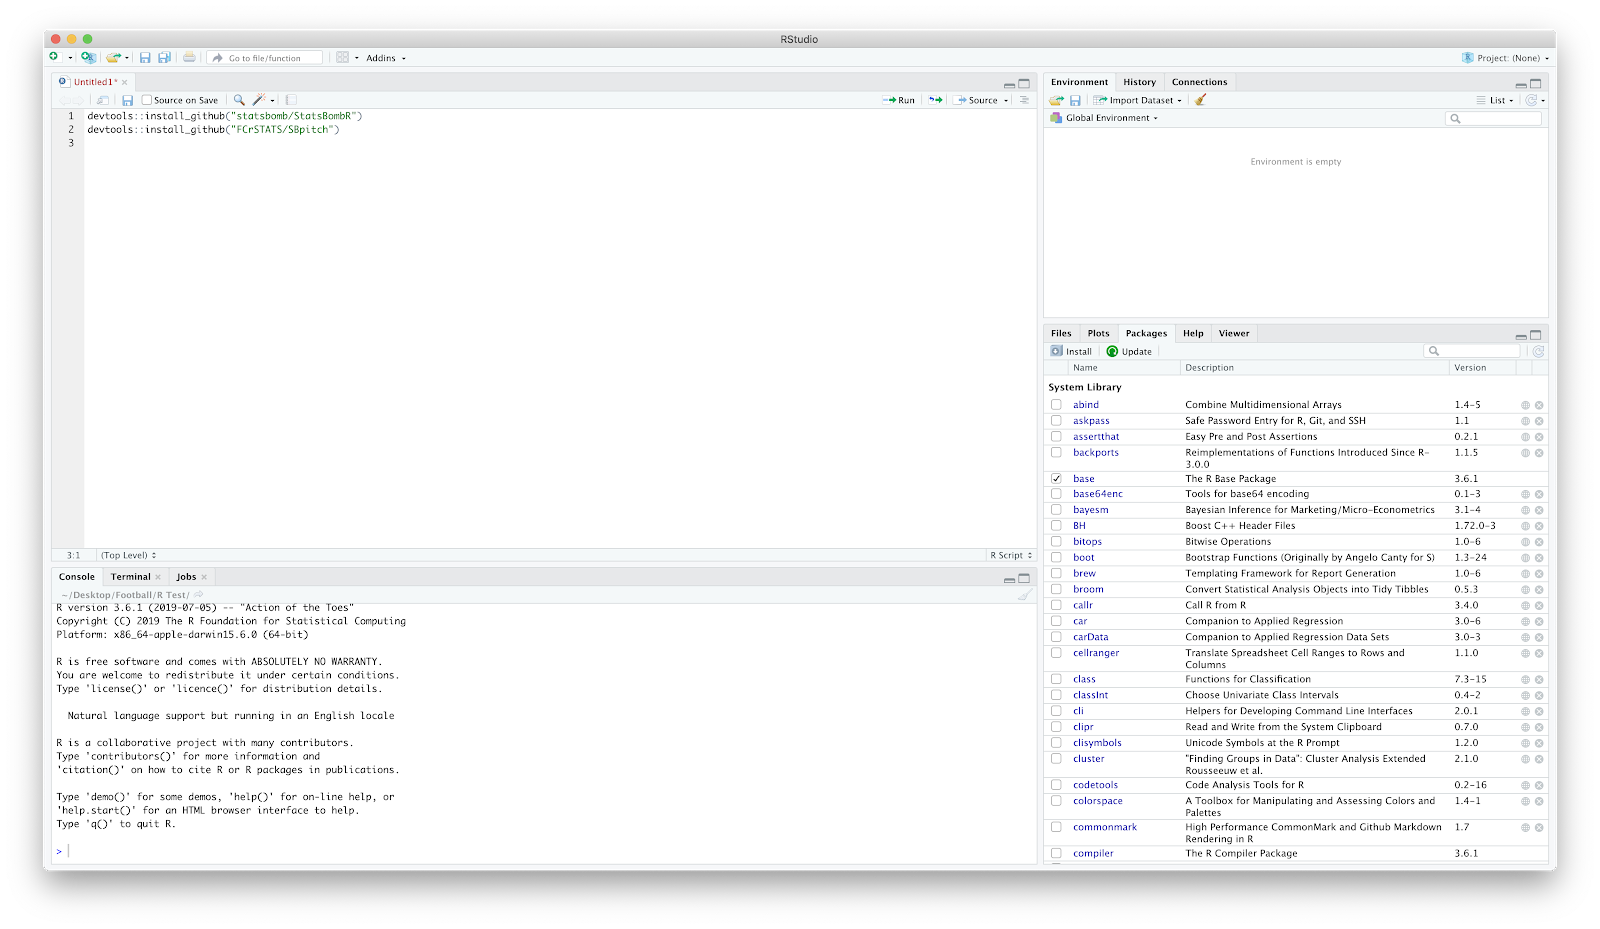
If you check the packages, there should now be 'SBpitch' and 'StatsBombR'.
Now the fun stuff starts...
Load in the packages 'StatsBombR', 'tidyverse' and 'SBpitch'.
Once this is typed, hit 'run' to fully load. You do this after each section of code.
Now to start loading in the data...
Input:
Comp<-FreeCompetitions()
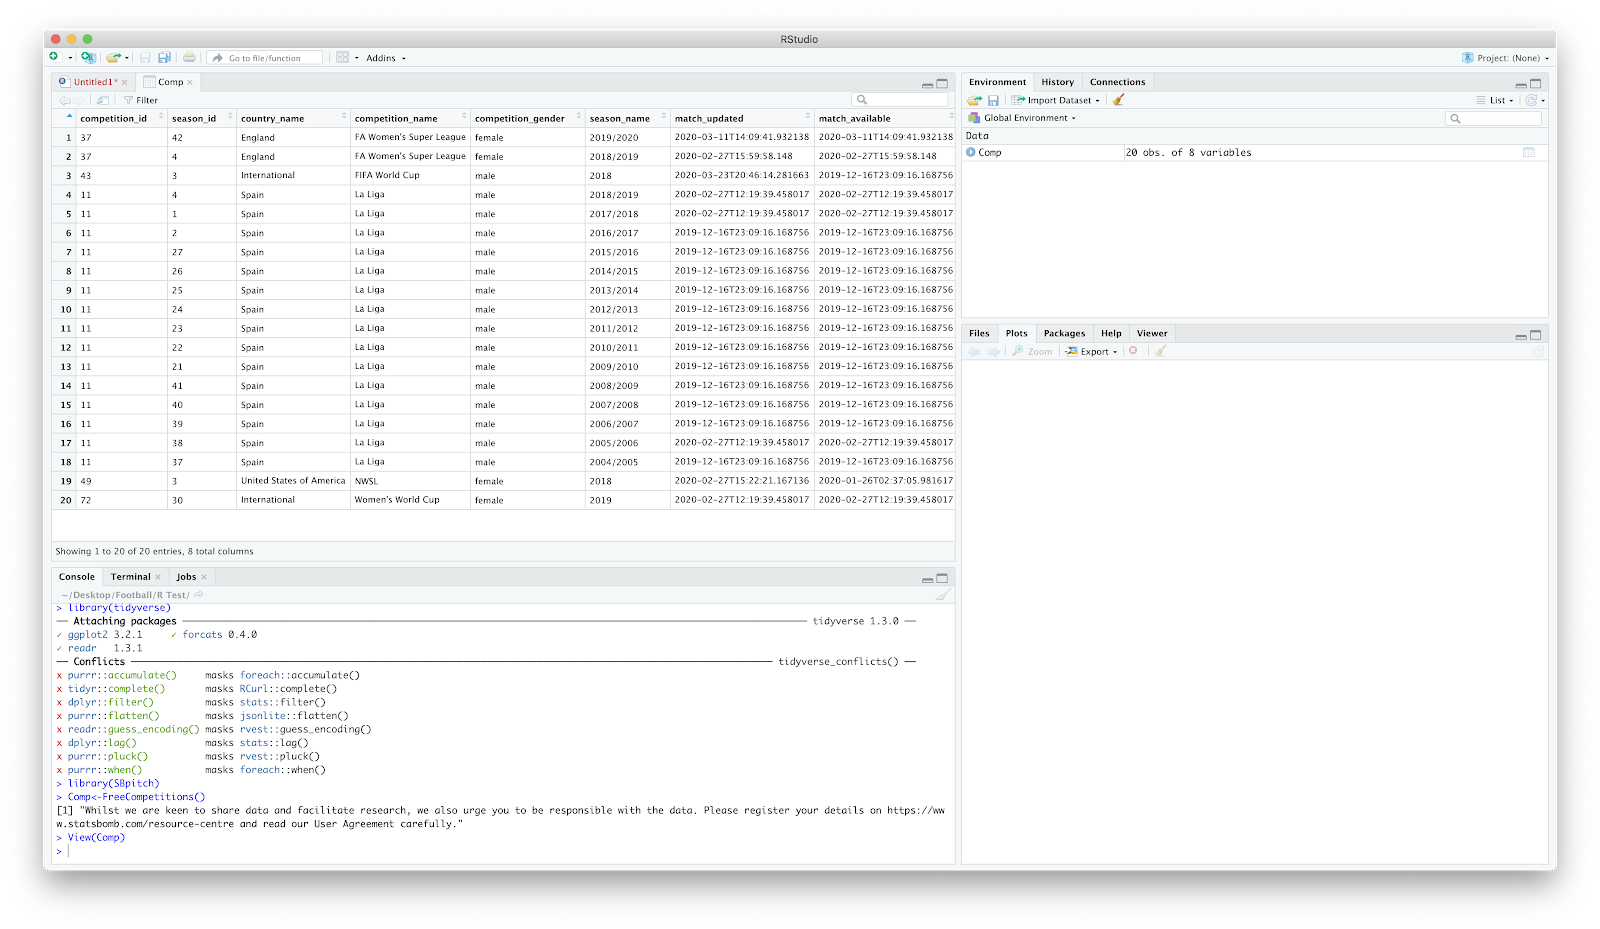
Again, after the 'Comp' code hit run and it should show in the window on the right.
This loads all the available StatsBomb competitions. By clicking 'Comp' you can view the competitions including the Messi data (competition_id = 11) and the FAWSL data (competition_id = 37, season_id = 42). We will use the FAWSL 2019/2020 data.
We now want to filter that competition data specifying the 'competition_id' and 'season_name'...
Comp<-FreeCompetitions()%>%filter(competition_id==37, season_name=="2019/2020")
Once again if you click 'Comp' on the right it should just display FAWSL 2019/20 season.
We now want to load all FAWSL matches -
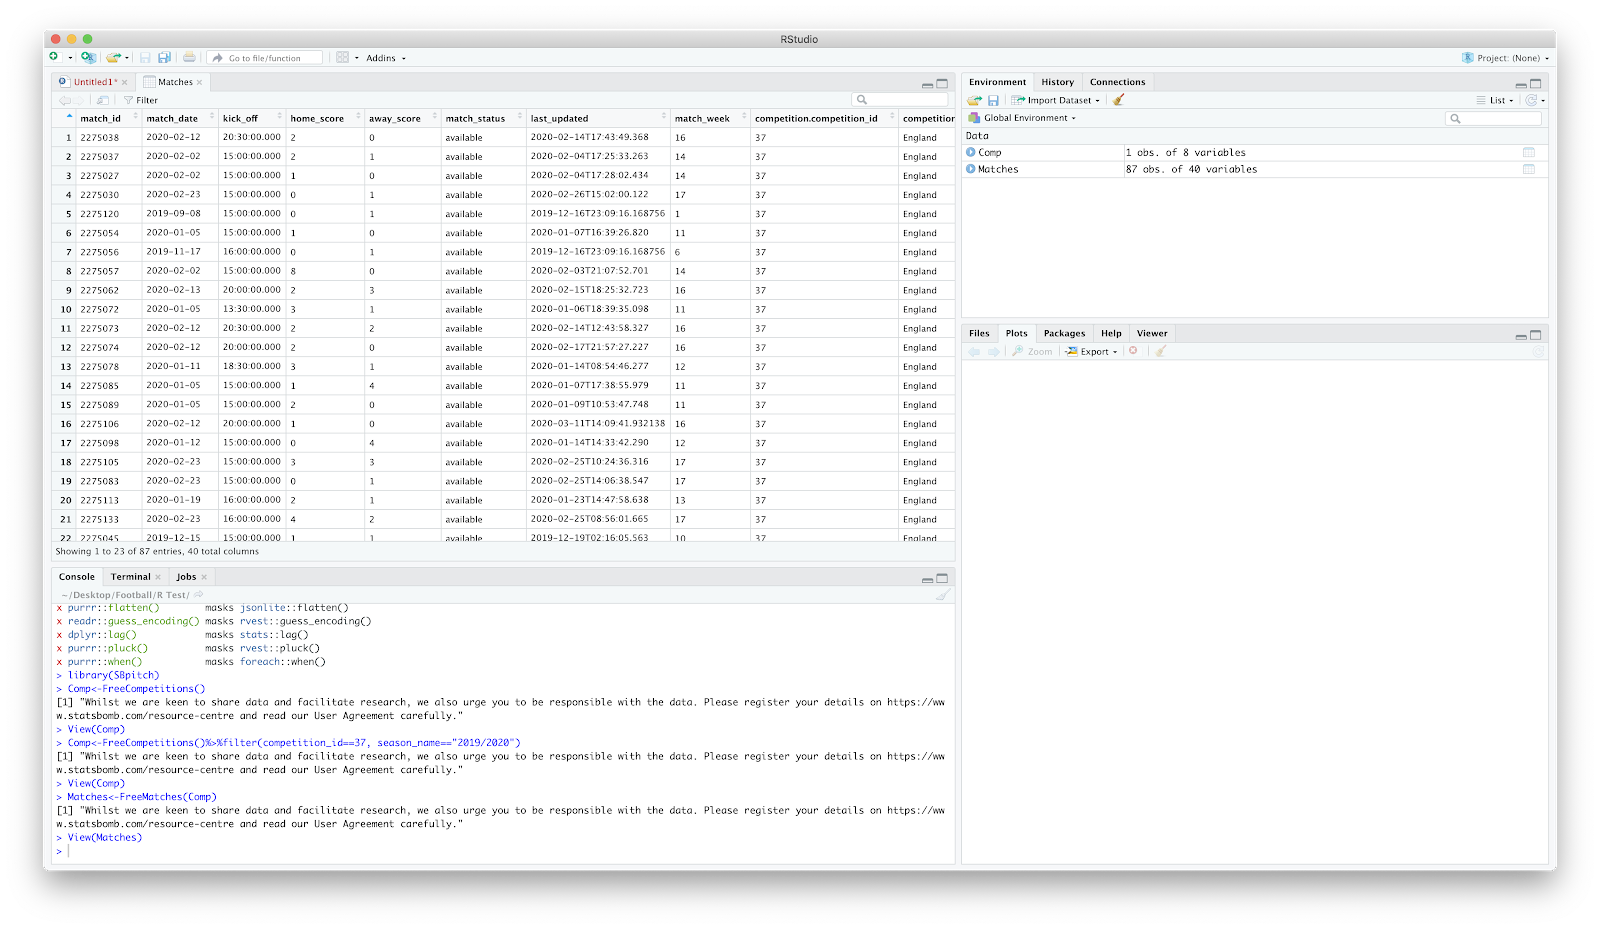
Matches<-FreeMatches(Comp)
Click 'Matches' on the right and have a look around the match data:
Next, to load the free event data associated with the Matches:
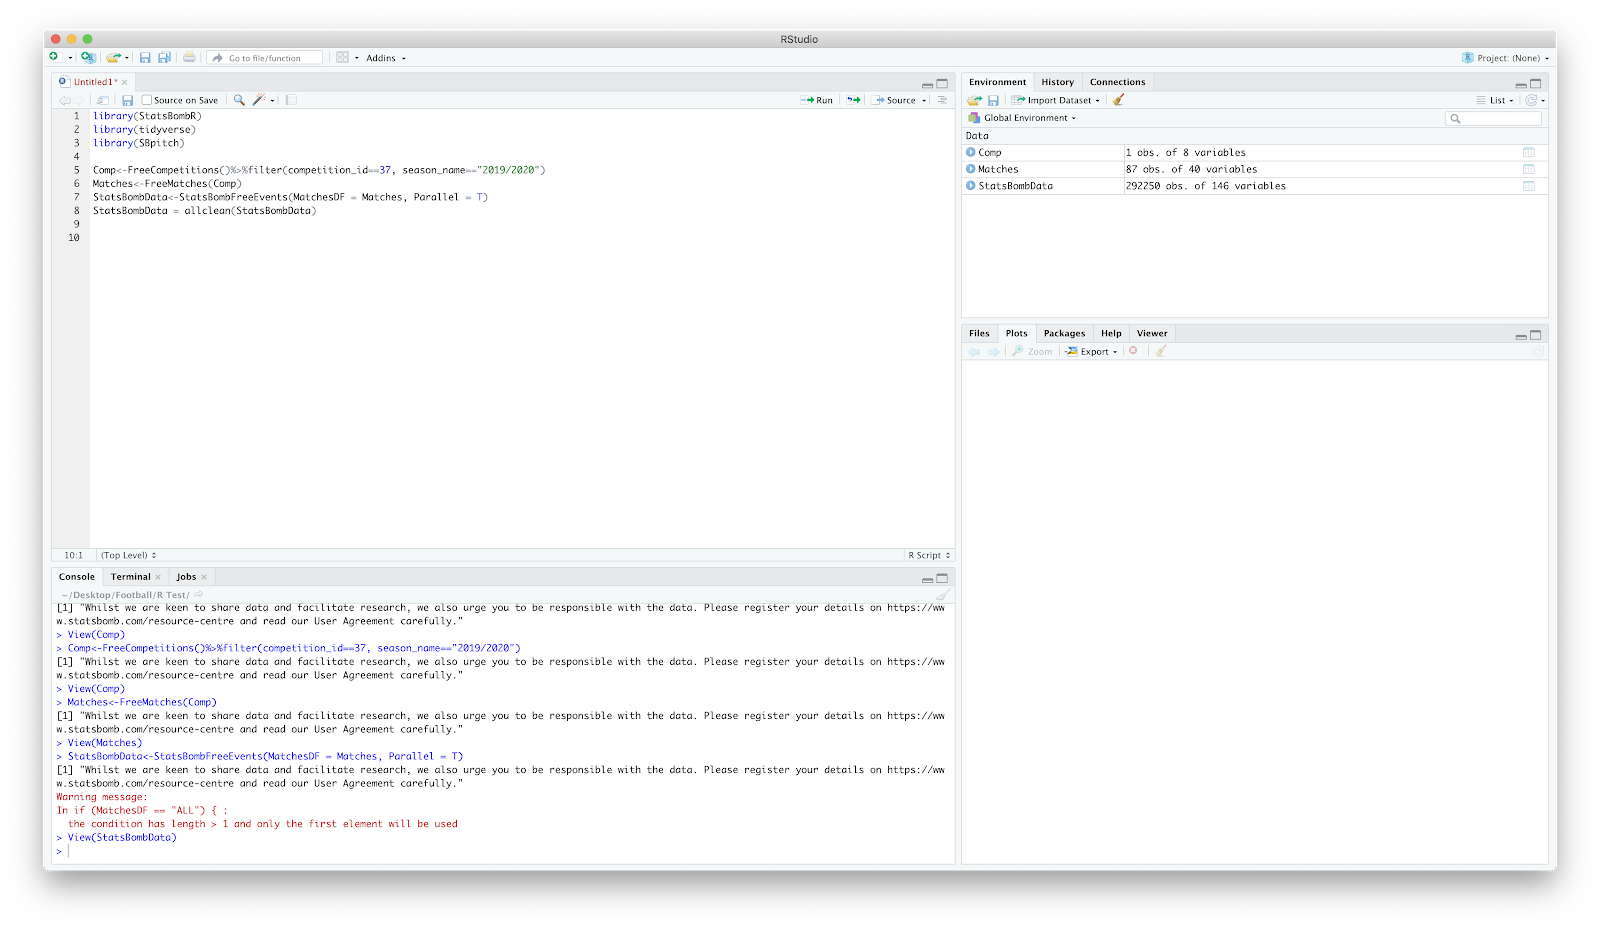
StatsBombData<-StatsBombFreeEvents(MatchesDF = Matches, Parallel = T)
Click StatsBombData on the right and have a look. Lots of scary numbers but StatsBomb have created an 'allclean' function that makes it less scary:
StatsBombData = allclean(StatsBombData)
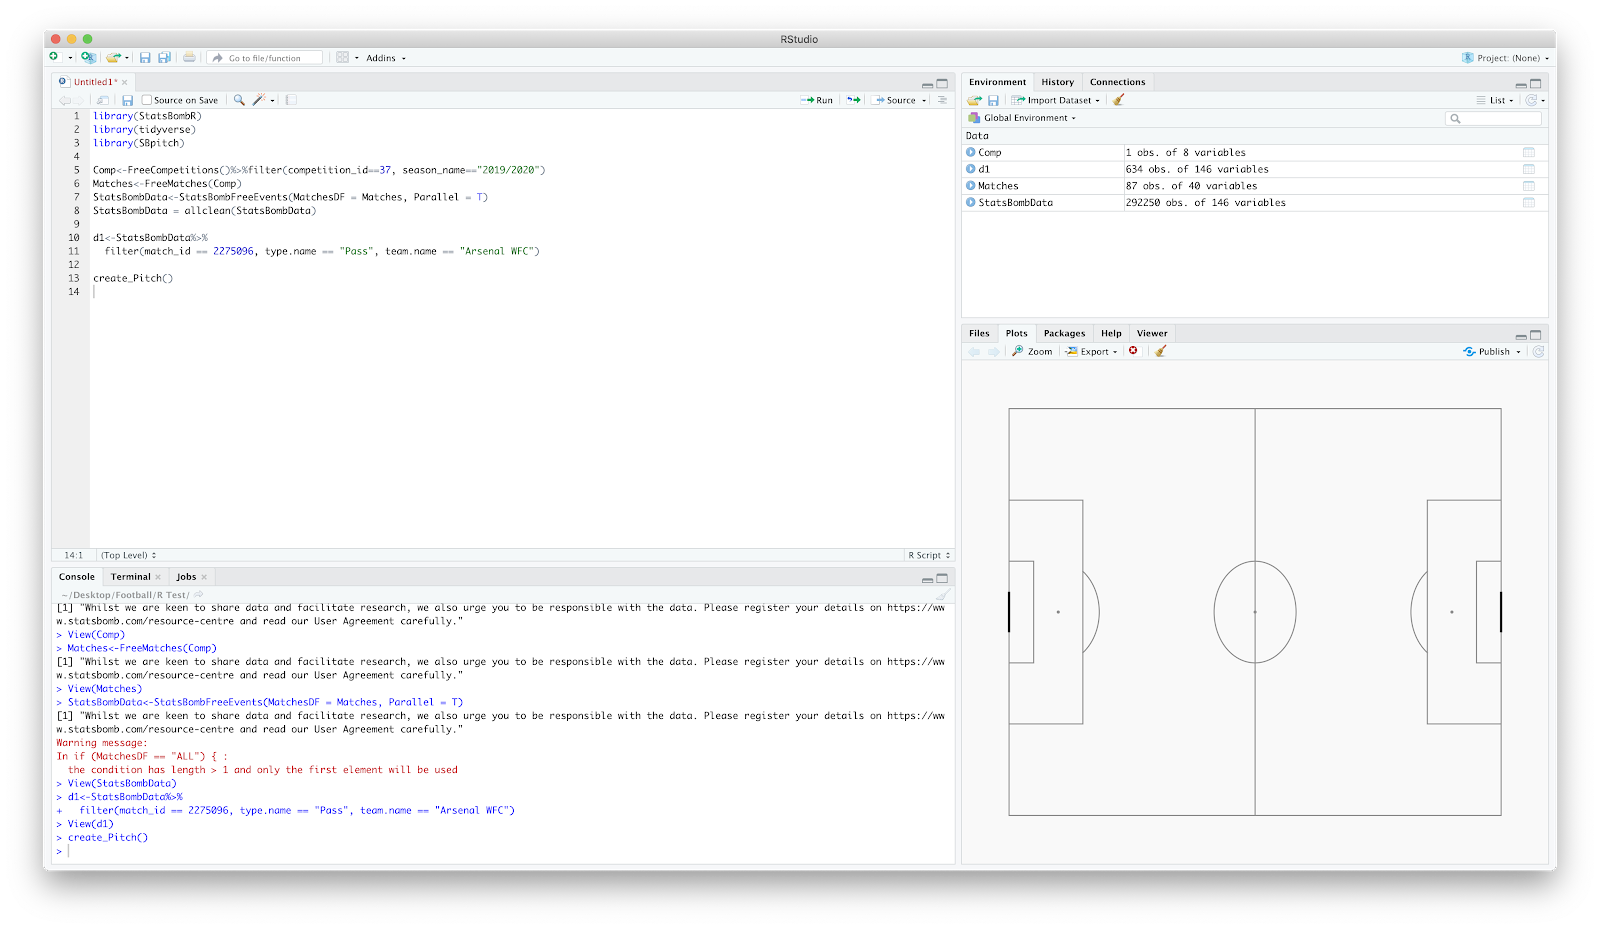
At this point, your screen should look like the following:
Now to filter the above for a single match:
d1<-StatsBombData%>%
filter(match_id == 2275096, type.name == "Pass", team.name == "Arsenal WFC")
This essentially reads as:
'get(<-) StatsBombData and filter (%>%filter) the match (match_id == 2275096) for passes (type.name == "Pass") associated with Arsenal (team.name == "Arsenal WFC") and assign to d1'.
Click d1 on the right and you should have all the Arsenal WFC event data associated with Arsenal WFC vs West Ham United LFC.
Yay.
Now to plot!
Lets get a pitch loaded. With the FCrSTATS 'SBpitch' package this is easy. Add:
create_Pitch()
Great - now to add the passes. The best way to think of this is simply as an elaborate scatter plot where you add layers. We have the base layer with the pitch, now to add where passes occurred:
geom_point(data = d1, aes(x = location.x, y = location.y))
This reads as:
"create a point (geom_point) using the filtered match data (data=d1) and plot the x and y coordinate (aes(x = location.x, y = location.y))"
You should hopefully now have:
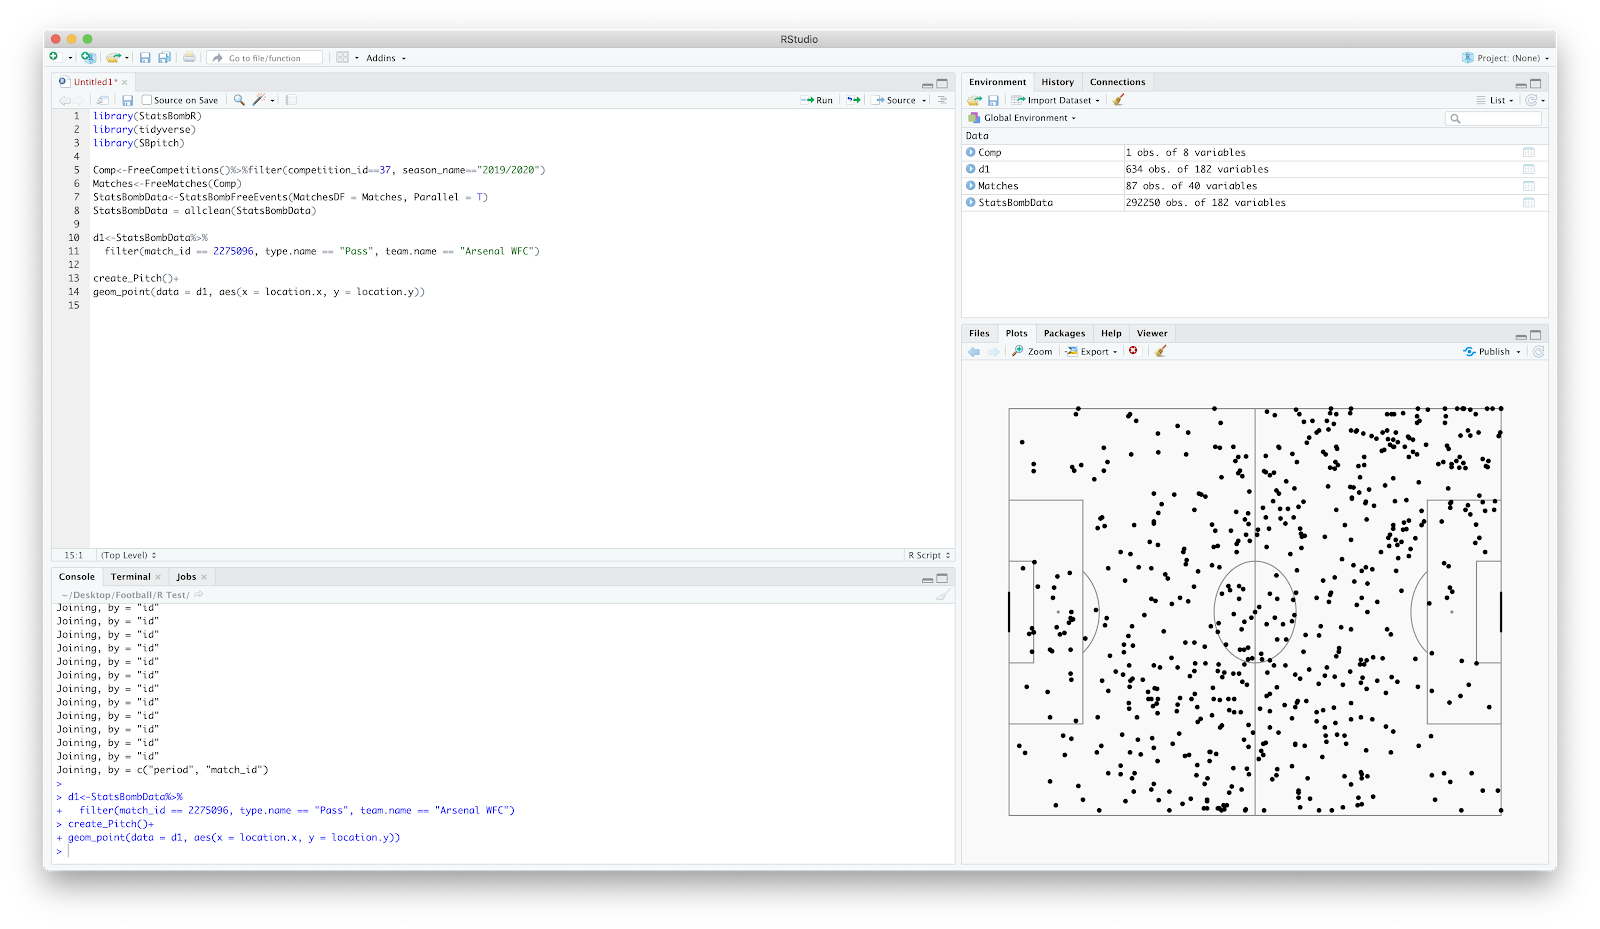
Woi oi. You have now plotted the start points of every Arsenal WFC pass vs West Ham United LFC. Go grab a biscuit and treat yourself.
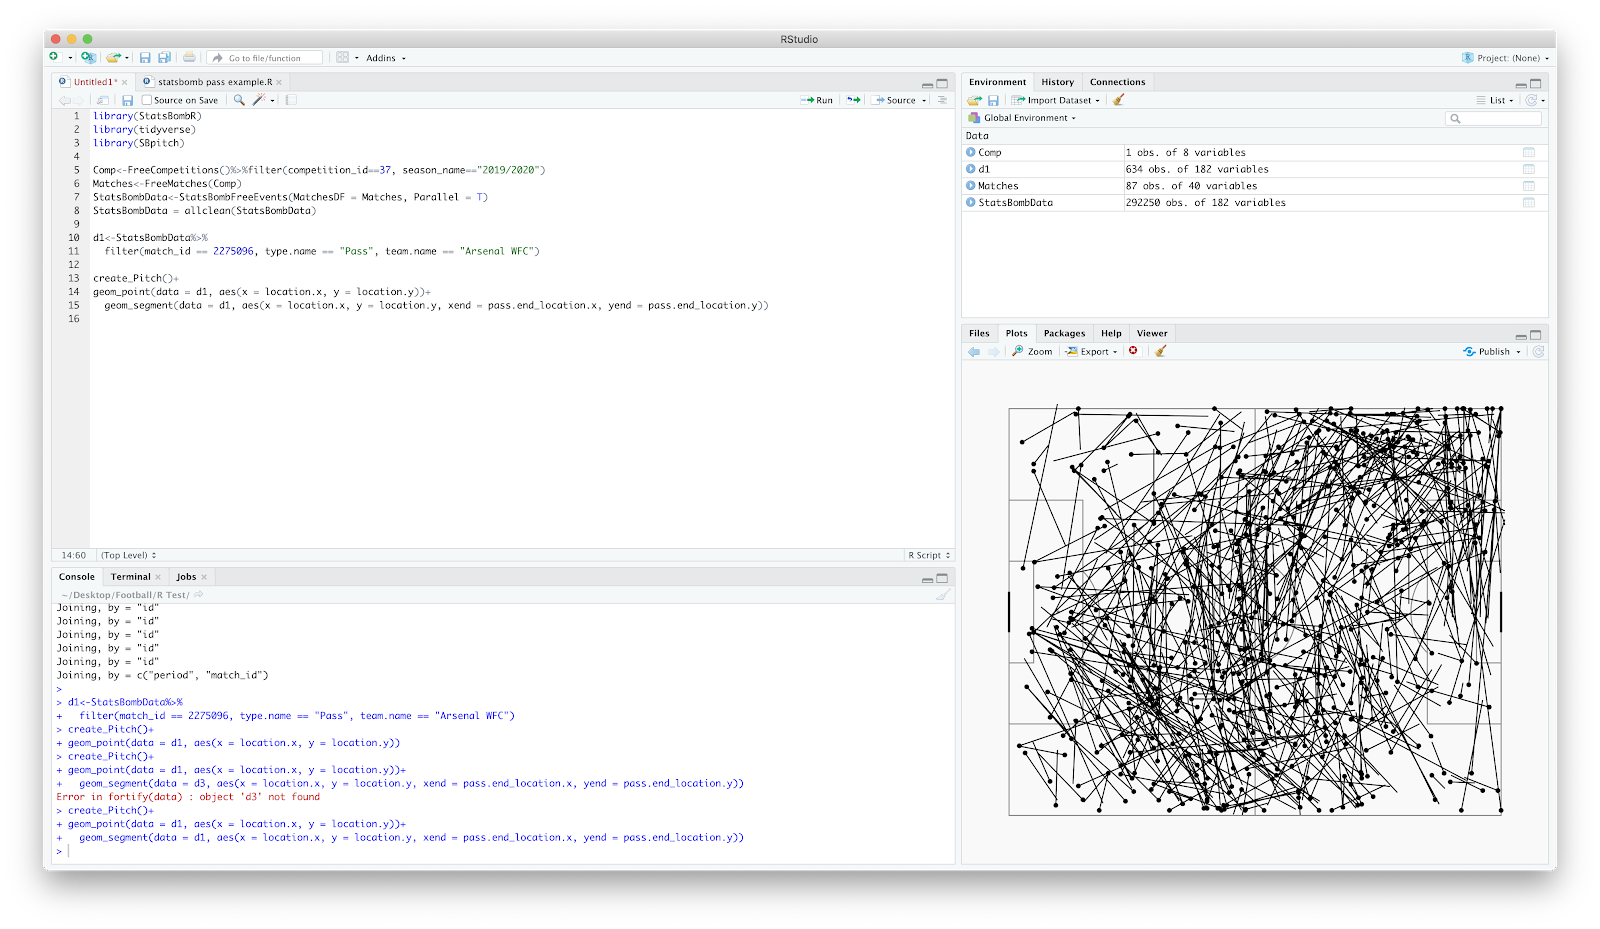
Refreshed and fuelled lets build on this plot. Lets add some lines so we can establish where the pass started and ended:
geom_segment(data = d1, aes(x = location.x, y = location.y, xend = pass.end_location.x, yend = pass.end_location.y))
Again, this uses calls for a line (geom_segment) to be drawn using the match data (d1) from the x/y start point to the x/y end point.
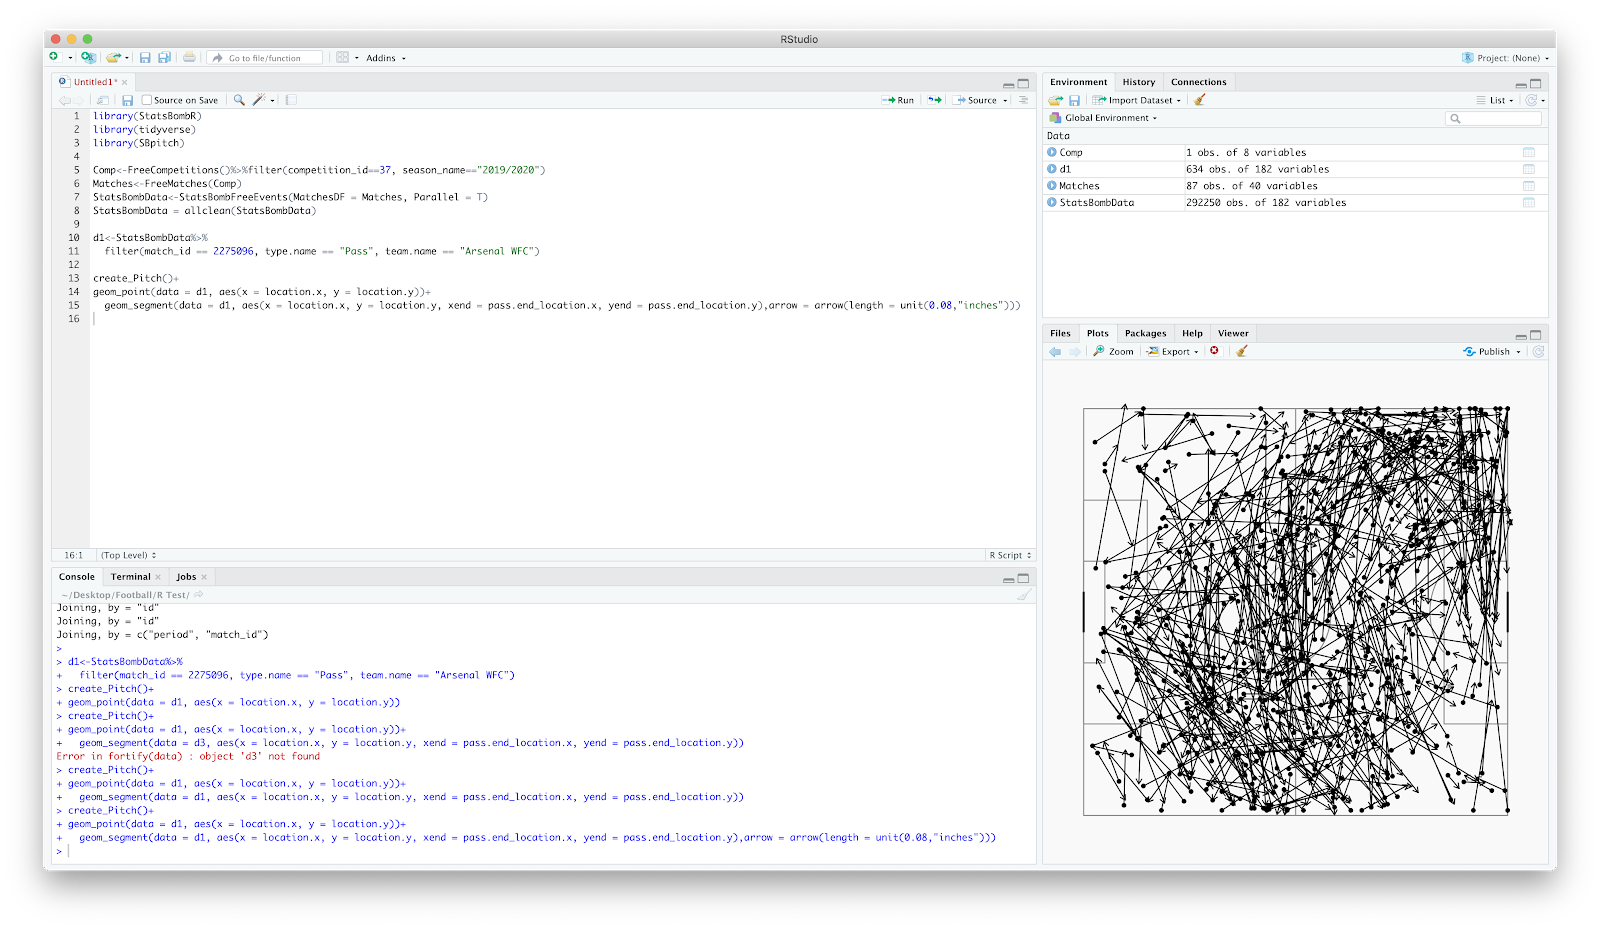
Great! Final few steps...lets add some arrows so the pass direction is clearer:
arrow = arrow(length = unit(0.08,"inches"))
Looks decent however the arrows are pretty dominant and cover the pitch. You can use the 'alpha' command to adjust both the point and line transparency:
alpha = 0.5
You need to add this both the geom_point and geom_segment section - have a play with differing transparency from 0.1 - 0.9 and see what you like!
Final two steps! You can change the colour of the passes by adding the colour command:
colour = "red"
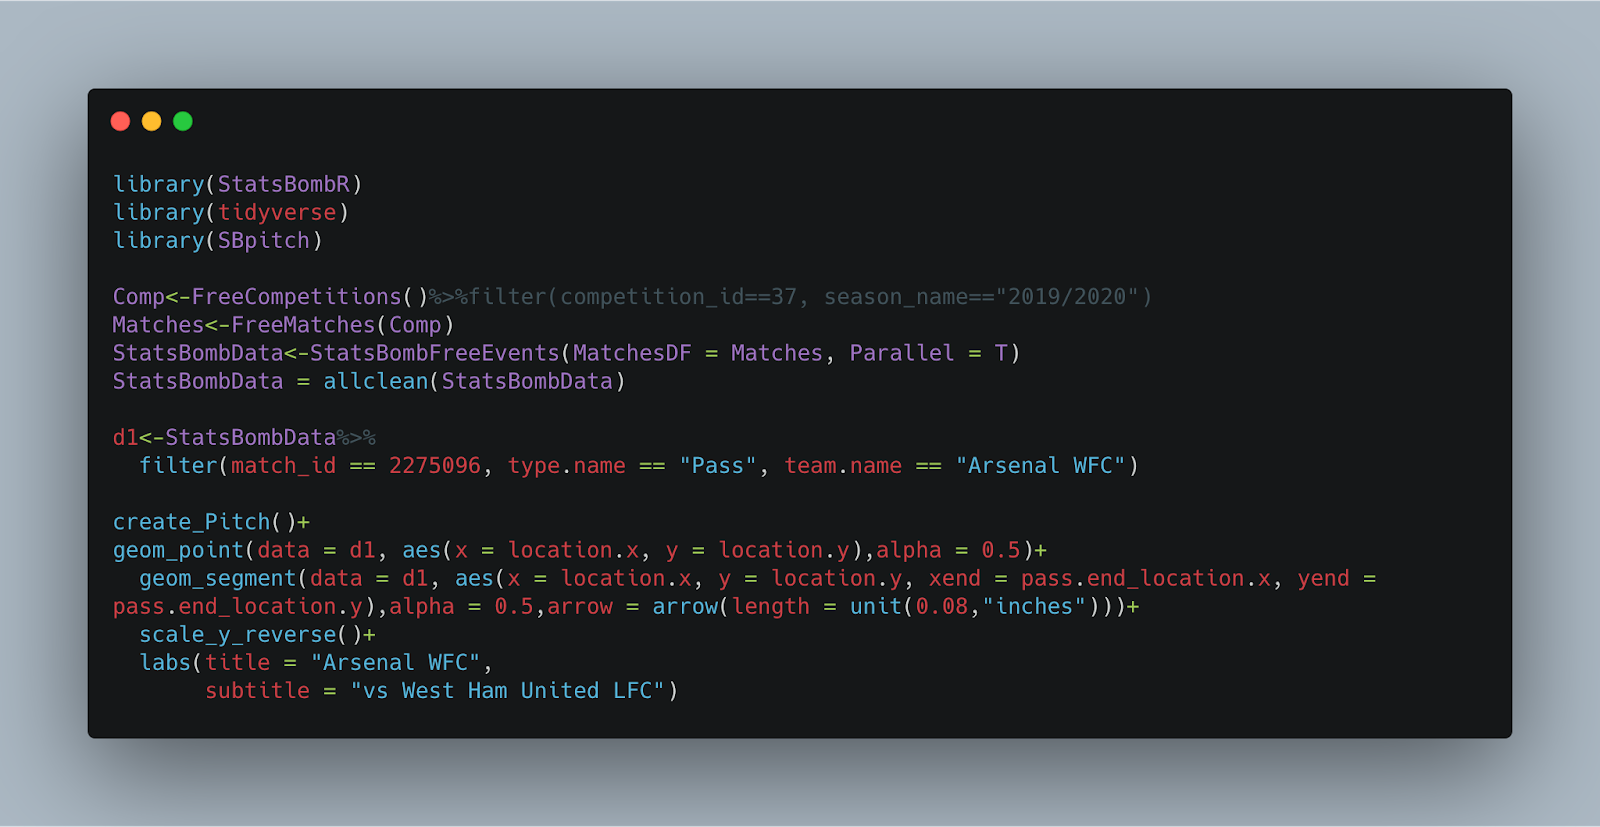
You can replace the 'red' with hex codes to customise further. Your full code should now look like this:
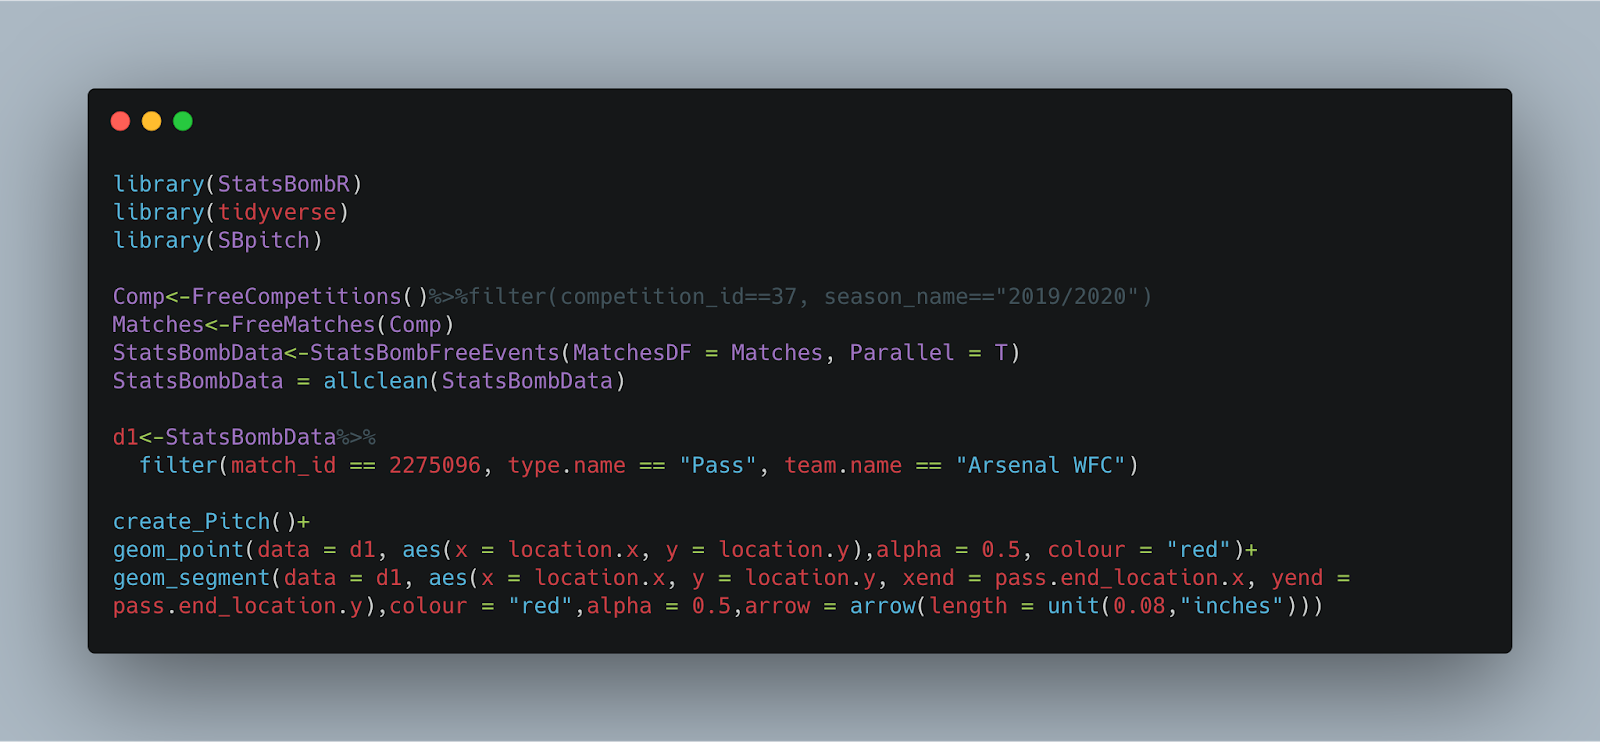
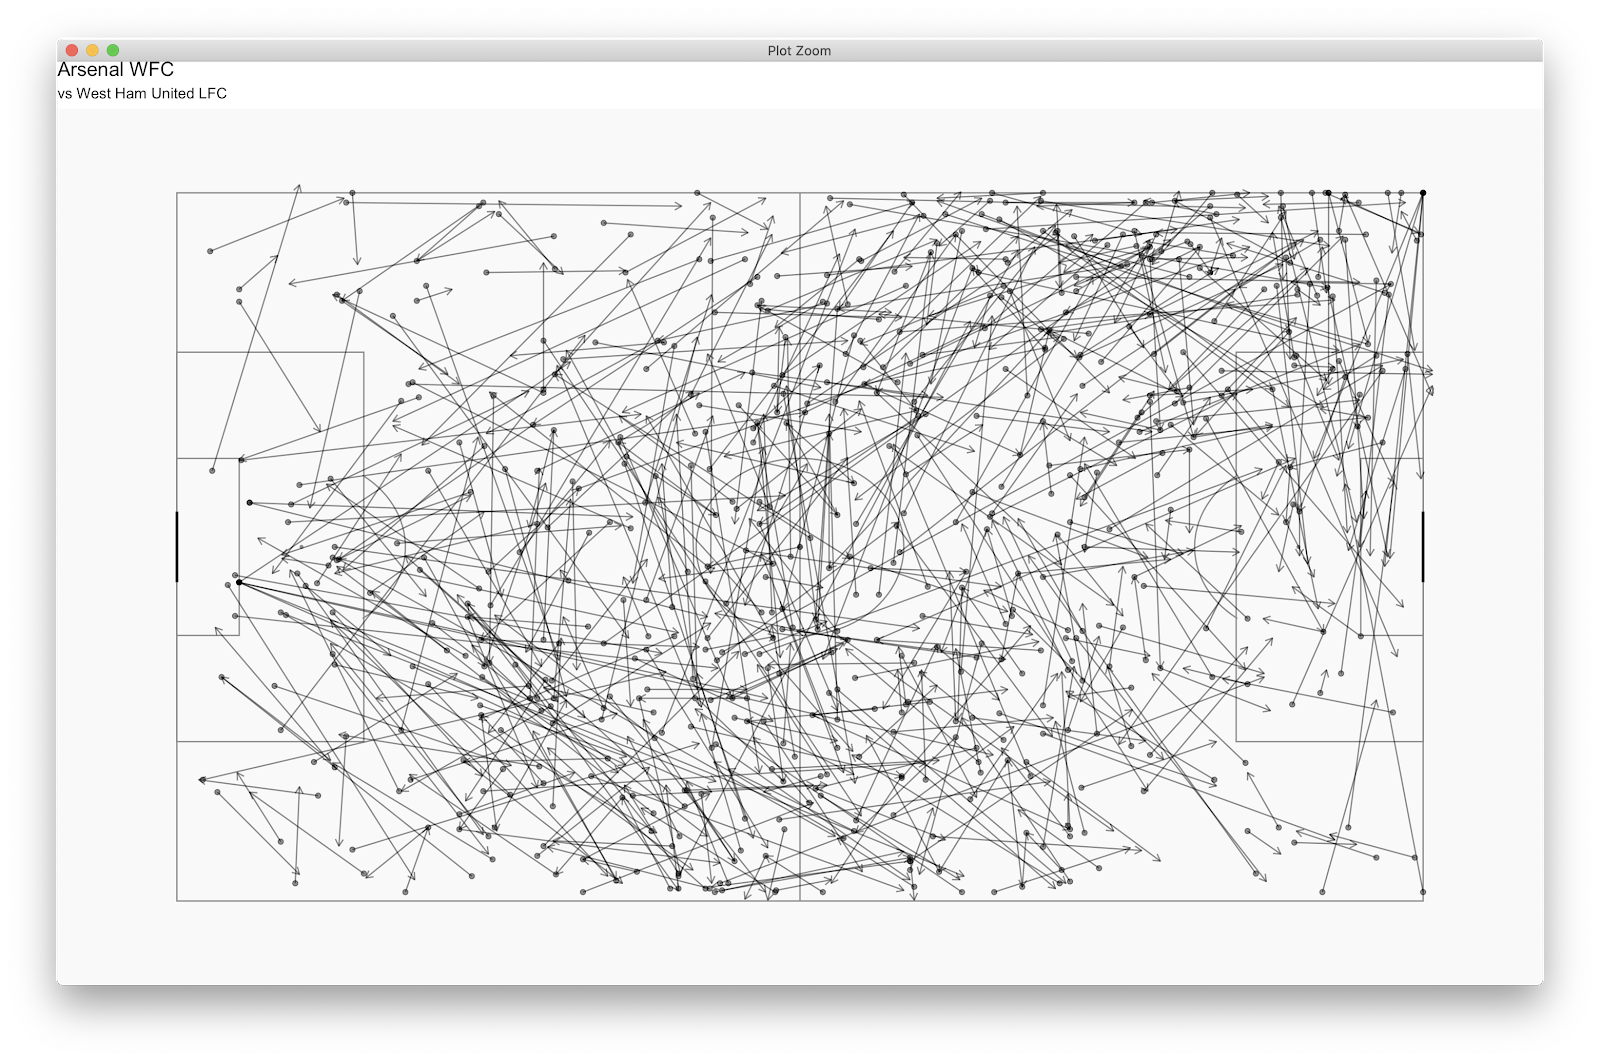
You should now have a lively plot, looking like this:

The y axis is incorrect on the create_pitch function...therefore if you plot the passes of a left back it will show up on the right.
To correct this you need to add:
scale_y_reverse()
You can add this after the geom_segment
Now, to finally add a title.
labs(title = "Arsenal WFC",
subtitle = "vs West Ham United LFC")
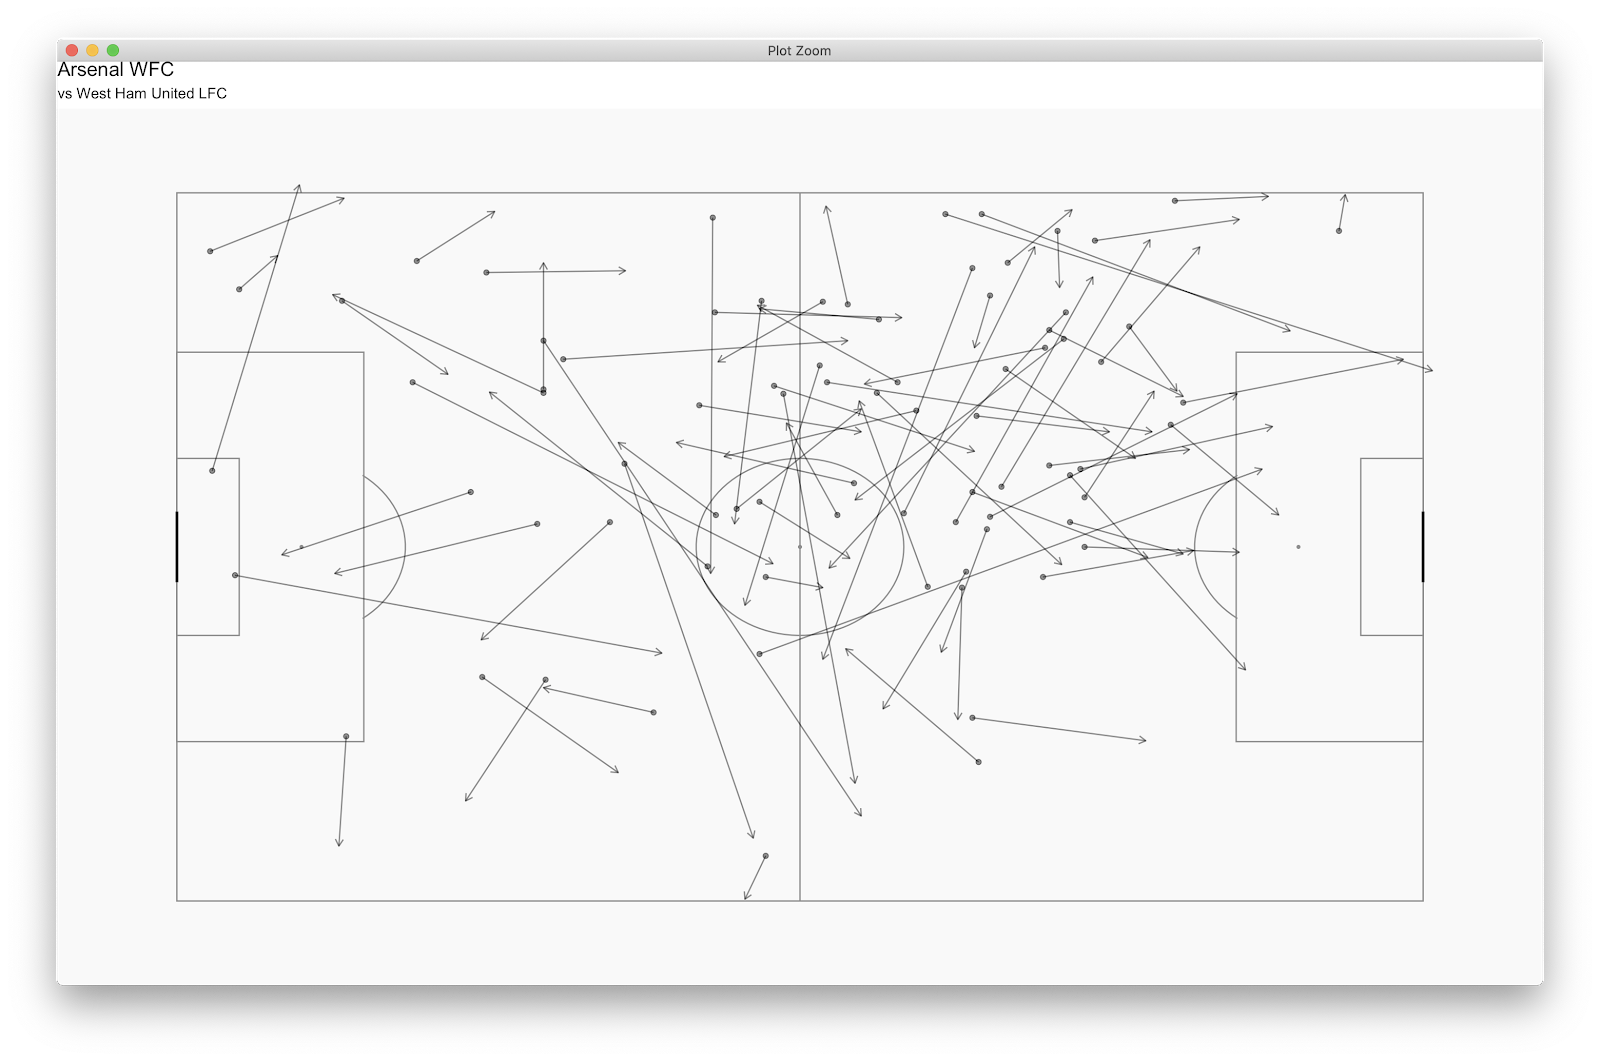
I have removed the "red" command but your final plot should now look like this:
Bang! Final little tinker...you can filter the above further by specifying which player you which to see the passes of. If you click 'd1' and scroll across to the 'player.name' header and column. From here, you can select a player, I have chosen Leah Williamson. You can add this to you 'd1' function:
d1<-StatsBombData%>%
filter(match_id == 2275096, type.name == "Pass", team.name == "Arsenal WFC", player.name == "Leah Williamson")
Run the plot once more and you should have:
Your final code should now be:
Hopefully this is helpful and has got you started on your R football coding journey! I'm a few months in but doing small amounts each day twinned with breaking things and trying to fix it seems to be how I progress fastest.
StatsBomb created a primer which is a must look to get a great overview: http://statsbomb.com/wp-content/uploads/2019/07/Using-StatsBomb-Data-In-R-English.pdf
If you need any help, let me know...I will do my best!
This will go through installing R, loading the StatsBomb data, then plotting a pass map - something like this:
Anyway, away we go.
Thing number 1 - install R. There are two things to load...the R 'base' and Rstudio.
You can download Rstudio here:
https://rstudio.com/products/rstudio/download/
The first 3 minutes of the below shows the process:
https://www.youtube.com/watch?v=BuaTLZyg0xs&list=PL6cDc8Xxld162nSsZ14bQnFn1cYStsrtk&index=2&t=0s
That is now hopefully R loaded. Open Rstudio and you should be greeted with something like this:
Press the arrow areas to reveal:
Under the 'Packages' tab select 'install' and search 'devtools'..install package. Repeat the previous step however search 'tidyverse'.
Next steps are to load in the StatsBomb data and FCrSTATS pitch:
devtools::install_github("statsbomb/StatsBombR")
devtools::install_github("FCrSTATS/SBpitch")
If you check the packages, there should now be 'SBpitch' and 'StatsBombR'.
Now the fun stuff starts...
Load in the packages 'StatsBombR', 'tidyverse' and 'SBpitch'.
Once this is typed, hit 'run' to fully load. You do this after each section of code.
Now to start loading in the data...
Input:
Comp<-FreeCompetitions()
Again, after the 'Comp' code hit run and it should show in the window on the right.
This loads all the available StatsBomb competitions. By clicking 'Comp' you can view the competitions including the Messi data (competition_id = 11) and the FAWSL data (competition_id = 37, season_id = 42). We will use the FAWSL 2019/2020 data.
We now want to filter that competition data specifying the 'competition_id' and 'season_name'...
Comp<-FreeCompetitions()%>%filter(competition_id==37, season_name=="2019/2020")
Once again if you click 'Comp' on the right it should just display FAWSL 2019/20 season.
We now want to load all FAWSL matches -
Matches<-FreeMatches(Comp)
Click 'Matches' on the right and have a look around the match data:
Next, to load the free event data associated with the Matches:
StatsBombData<-StatsBombFreeEvents(MatchesDF = Matches, Parallel = T)
Click StatsBombData on the right and have a look. Lots of scary numbers but StatsBomb have created an 'allclean' function that makes it less scary:
StatsBombData = allclean(StatsBombData)
At this point, your screen should look like the following:
Now to filter the above for a single match:
d1<-StatsBombData%>%
filter(match_id == 2275096, type.name == "Pass", team.name == "Arsenal WFC")
This essentially reads as:
'get(<-) StatsBombData and filter (%>%filter) the match (match_id == 2275096) for passes (type.name == "Pass") associated with Arsenal (team.name == "Arsenal WFC") and assign to d1'.
Click d1 on the right and you should have all the Arsenal WFC event data associated with Arsenal WFC vs West Ham United LFC.
Yay.
Now to plot!
Lets get a pitch loaded. With the FCrSTATS 'SBpitch' package this is easy. Add:
create_Pitch()
Great - now to add the passes. The best way to think of this is simply as an elaborate scatter plot where you add layers. We have the base layer with the pitch, now to add where passes occurred:
geom_point(data = d1, aes(x = location.x, y = location.y))
This reads as:
"create a point (geom_point) using the filtered match data (data=d1) and plot the x and y coordinate (aes(x = location.x, y = location.y))"
You should hopefully now have:
Woi oi. You have now plotted the start points of every Arsenal WFC pass vs West Ham United LFC. Go grab a biscuit and treat yourself.
Refreshed and fuelled lets build on this plot. Lets add some lines so we can establish where the pass started and ended:
geom_segment(data = d1, aes(x = location.x, y = location.y, xend = pass.end_location.x, yend = pass.end_location.y))
Again, this uses calls for a line (geom_segment) to be drawn using the match data (d1) from the x/y start point to the x/y end point.
Great! Final few steps...lets add some arrows so the pass direction is clearer:
arrow = arrow(length = unit(0.08,"inches"))
Looks decent however the arrows are pretty dominant and cover the pitch. You can use the 'alpha' command to adjust both the point and line transparency:
alpha = 0.5
You need to add this both the geom_point and geom_segment section - have a play with differing transparency from 0.1 - 0.9 and see what you like!
Final two steps! You can change the colour of the passes by adding the colour command:
colour = "red"
You can replace the 'red' with hex codes to customise further. Your full code should now look like this:
You should now have a lively plot, looking like this:
The y axis is incorrect on the create_pitch function...therefore if you plot the passes of a left back it will show up on the right.
To correct this you need to add:
scale_y_reverse()
You can add this after the geom_segment
Now, to finally add a title.
labs(title = "Arsenal WFC",
subtitle = "vs West Ham United LFC")
I have removed the "red" command but your final plot should now look like this:
Bang! Final little tinker...you can filter the above further by specifying which player you which to see the passes of. If you click 'd1' and scroll across to the 'player.name' header and column. From here, you can select a player, I have chosen Leah Williamson. You can add this to you 'd1' function:
d1<-StatsBombData%>%
filter(match_id == 2275096, type.name == "Pass", team.name == "Arsenal WFC", player.name == "Leah Williamson")
Run the plot once more and you should have:
Your final code should now be:
Hopefully this is helpful and has got you started on your R football coding journey! I'm a few months in but doing small amounts each day twinned with breaking things and trying to fix it seems to be how I progress fastest.
StatsBomb created a primer which is a must look to get a great overview: http://statsbomb.com/wp-content/uploads/2019/07/Using-StatsBomb-Data-In-R-English.pdf
If you need any help, let me know...I will do my best!
Hi Mark!
ReplyDeleteI follow you on Twitter and I am fairly new at R too. I like your heatmap you posted on March 31st. Do you mind sharing your code on that one?
Best,
Simon from Denmark.
Getting Started In R With Statsbomb Data >>>>> Download Now
Delete>>>>> Download Full
Getting Started In R With Statsbomb Data >>>>> Download LINK
>>>>> Download Now
Getting Started In R With Statsbomb Data >>>>> Download Full
>>>>> Download LINK AV
Nice post. I have a news football site from my country. If you have a free time. You can visit here.
ReplyDeleteคาสิโนออนไลน์
Excellent Blog I like your blog and It is very informative. Thank you
ReplyDeleteLearn R Programming Online
Puppet Online Training
Azure online courses
I really appreciate your support on this.
ReplyDeleteLook forward to hearing from you soon.
I’m happy to answer your questions, if you have any.
แจกเครดิตฟรี ฝากถอนง่าย
เล่นบาคาร่า
คาสิโน
Many thanks for your kind invitation. I’ll join you.
ReplyDeleteWould you like to play cards?
Come to the party with me, please.
Look forward to hearing from you soon.
I’m happy to answer your questions, if you have any.
เล่นบาคาร่า
เครดิตฟรี
แจกเครดิตฟรี ฝากถอนง่าย
คาสิโน
Wonderful blog. Thanks for sharing a useful information.........
ReplyDeleteJava Training in Chennai
Java Online Course
Java Training in Bangalore
Nice blog, very informative content.Thanks for sharing, waiting for the next update…
ReplyDeleteWeb-Based Applications of Java
What is Java Programming?
ReplyDeleteHey friend, it is very well written article, thank you for the valuable and useful information you provide in this post. Keep up the good work! FYI, please check these depression, stress and anxiety related articles.
How to Build a Portfolio with ETFs, My vision for India in 2047 postcard, Essay on Unsung Heroes of Freedom Struggle
I like your all post. You have done really good work.
ReplyDeleteThank you for the information you provide, it helped me a lot.
KeepVid Pro Crack
ScriptCase Crack
R-Studio Crack
This post is so interactive and informative.keep update more information...
ReplyDeleteSoftware testing training in Tambaram
Software testing training in chennai
I like your all post. You have done really good work. Thank you for the information you provide, it helped me a lot. crackproz.org I hope to have many more entries or so from you.
ReplyDeleteVery interesting blog.
R-Studio Network Technician Crack
My response on my own website. Appreciation is a wonderful thing...thanks for sharing keep it up. AOMEI Partition Assistant Crack
ReplyDeleteGlarysoft Malware Hunter Crack
R-Studio Crack
Avast SecureLine VPN Crack
Raxco PerfectRegistry Crack
Norton Utilities Crack
Getting Started In R With Statsbomb Data >>>>> Download Now
ReplyDelete>>>>> Download Full
Getting Started In R With Statsbomb Data >>>>> Download LINK
>>>>> Download Now
Getting Started In R With Statsbomb Data >>>>> Download Full
>>>>> Download LINK 5l
Very interesting, good job, and thanks for sharing such a good blog.
ReplyDeleteเว็บบอล
Great post. keep sharing such a worthy information.
ReplyDeleteRobot Framework Test Automation Online Training
Error in if (MatchesDF == "ALL") { : the condition has length > 1 having this issue when prompting StatsBombData <- StatsBombFreeEvents(MatchesDF = Matches, Parallel = T). please help
ReplyDeleteThis comment has been removed by the author.
ReplyDeleteNursing jobs in Germany offer a rewarding opportunity for healthcare professionals seeking to work in a well-structured and respected healthcare system. Candidates must hold a recognised nursing qualification and possess fluency in German, as strong communication skills are essential for effective patient care. Roles often include working in hospitals, clinics, or nursing homes, where nurses collaborate with multidisciplinary teams to provide comprehensive care. The demand for skilled nurses is high, offering competitive salaries and benefits, including health insurance and pension schemes. Additionally, opportunities for ongoing professional development and specialisation are abundant. Germany's emphasis on work-life balance and job security makes it an attractive destination for international nursing professionals. Join a country that values healthcare excellence and experience a fulfilling career in nursing.
ReplyDeletehttps://www.dynamichealthstaff.com/nursing-jobs-in-germany
I'm really impressed with your writing skills, as smart as the structure of your weblog.
ReplyDeleteAOMEI Partition Assistant Crack
VueScan Pro Crack
R programming is widely used for statistical analysis, data visualization, and data science projects, making it a challenging subject for many students. I’ve noticed that getting r programming assignment help can be useful when dealing with complex coding tasks, regression models, and data interpretation. Expert guidance not only helps in completing assignments accurately but also improves understanding of R concepts, which is beneficial for academic performance and future career opportunities in analytics and research.
ReplyDelete#1 Website Software Easy to Free Download
ReplyDeleteDownload Partition Wizard Full Version: The Best Hard Drive Partitioning and Management Software of 2026